It’s 2am. An alert fires. A payment service is returning 500s. The on-call engineer opens their laptop, navigates to the dashboard, and stares at a graph that shows error rates are elevated. That’s it. That’s all the graph shows.
No context. No trace of what happened. No way to tell which requests failed, why, or whether it’s one endpoint or all of them. Just a line going up.
This is not observability. This is monitoring. And monitoring alone is not enough.
Observability is the ability to understand the internal state of a system from its external outputs. Not just “is it broken?” but “why is it broken, where exactly, under what conditions, and what does the failure path look like?”
This article covers how to actually build it — the three pillars, the implementation patterns, and the hard lessons from running services in production.
The Three Pillars, and Why Each One Exists
- Logs answer: What happened?
- Metrics answer: How often / how much?
- Traces answer: Where in the call chain did it happen?
Each serves a different part of the diagnostic workflow. You need all three. A system with only metrics can tell you something is wrong but not where. A system with only logs can tell you what happened but not at what rate. A system with only traces shows individual request paths but misses aggregate patterns.
flowchart LR
    INC["Incident"] --> MET["Metrics\nWhat's elevated?"]
    MET --> LOG["Logs\nWhat happened?"]
    LOG --> TRC["Traces\nWhere in the chain?"]
    TRC --> RCA["Root Cause"]
    style INC fill:#c0392b,color:#fff
    style RCA fill:#27ae60,color:#fff
Pillar 1: Structured Logging
The biggest mistake teams make is treating logs as human-readable text:
log.Printf("Processing order %s for customer %d failed: %v", orderID, customerID, err)This is readable. It is unsearchable at scale. When you have 10 million log lines and want to find all orders that failed with a connection timeout in a specific region, you can’t — not without a fragile regex.
Structured logging means emitting logs as key-value pairs:
logger.Error("order processing failed",
    "order_id", orderID,
    "customer_id", customerID,
    "error", err.Error(),
    "duration_ms", elapsed.Milliseconds(),
    "region", region,
)
Output:
{
  "level": "ERROR",
  "msg": "order processing failed",
  "order_id": "ord_abc123",
  "customer_id": 9871,
  "error": "connection timeout",
  "duration_ms": 5043,
  "region": "NG-WEST"
}
Now your log aggregator can filter on any field. error = "connection timeout" AND region = "NG-WEST" becomes a trivial query.
Correlation IDs
Thread a single request ID through every log line for a given request:
func Middleware(next http.Handler) http.Handler {
    return http.HandlerFunc(func(w http.ResponseWriter, r *http.Request) {
        requestID := r.Header.Get("X-Request-ID")
        if requestID == "" {
            requestID = uuid.NewString()
        }
        ctx := context.WithValue(r.Context(), "request_id", requestID)
        w.Header().Set("X-Request-ID", requestID)
        next.ServeHTTP(w, r.WithContext(ctx))
    })
}
Filter your log aggregator to request_id = "abc-123" and you get the complete story of exactly one request — across all services that handled it.
Pillar 2: Metrics
Metrics are numeric measurements of system behavior over time. The RED method gives you the minimum useful set for any service:
- Rate: requests per second
- Errors: failed requests per second
- Duration: how long requests take (as a distribution)
Histograms, Not Averages
Never use averages for latency. Averages lie.
If 99% of requests complete in 10ms and 1% take 10 seconds, your average latency is ~110ms — telling you nothing useful. Use percentiles:
- P50: the typical experience
- P95: what most users see when it’s worse than normal
- P99: what your most affected users experience
- P99.9: the long tail — often where your most valuable customers live
var requestDuration = prometheus.NewHistogramVec(
    prometheus.HistogramOpts{
        Name:    "http_request_duration_seconds",
        Buckets: prometheus.DefBuckets,
    },
    []string{"route", "method", "status_code"},
)

timer := prometheus.NewTimer(
    requestDuration.WithLabelValues(route, method, strconv.Itoa(statusCode)),
)
defer timer.ObserveDuration()
Alerting on Symptoms, Not Causes
Alert on “error rate > 5%” (a symptom users feel), not “database CPU > 80%” (a cause that may or may not be producing user pain). Start from user experience and work backwards.
Pillar 3: Distributed Tracing
Traces answer the question logs and metrics can’t: for a specific request through multiple services, what was the end-to-end path, and where did time get spent?
A trace is a tree of spans. Each span represents a unit of work — a service handling the request, a database query, an external API call.
flowchart TD
    ROOT["API Gateway [0ms → 245ms]"]
    ROOT --> AUTH["Auth Service [2ms → 18ms]"]
    ROOT --> ORDER["Order Service [20ms → 230ms]"]
    ORDER --> DB1["DB Query - orders [22ms → 45ms]"]
    ORDER --> PAY["Payment Service [50ms → 220ms]"]
    PAY --> DB2["DB Query - payments [52ms → 60ms]"]
    PAY --> EXT["Paystack API [65ms → 215ms] ⚠️ SLOW"]
    style EXT fill:#e67e22,color:#fff
    style ROOT fill:#c0392b,color:#fff
This visualization immediately shows the Paystack API call is consuming 150ms of the 245ms total. Without tracing, you’d manually correlate log lines across three services to find this.
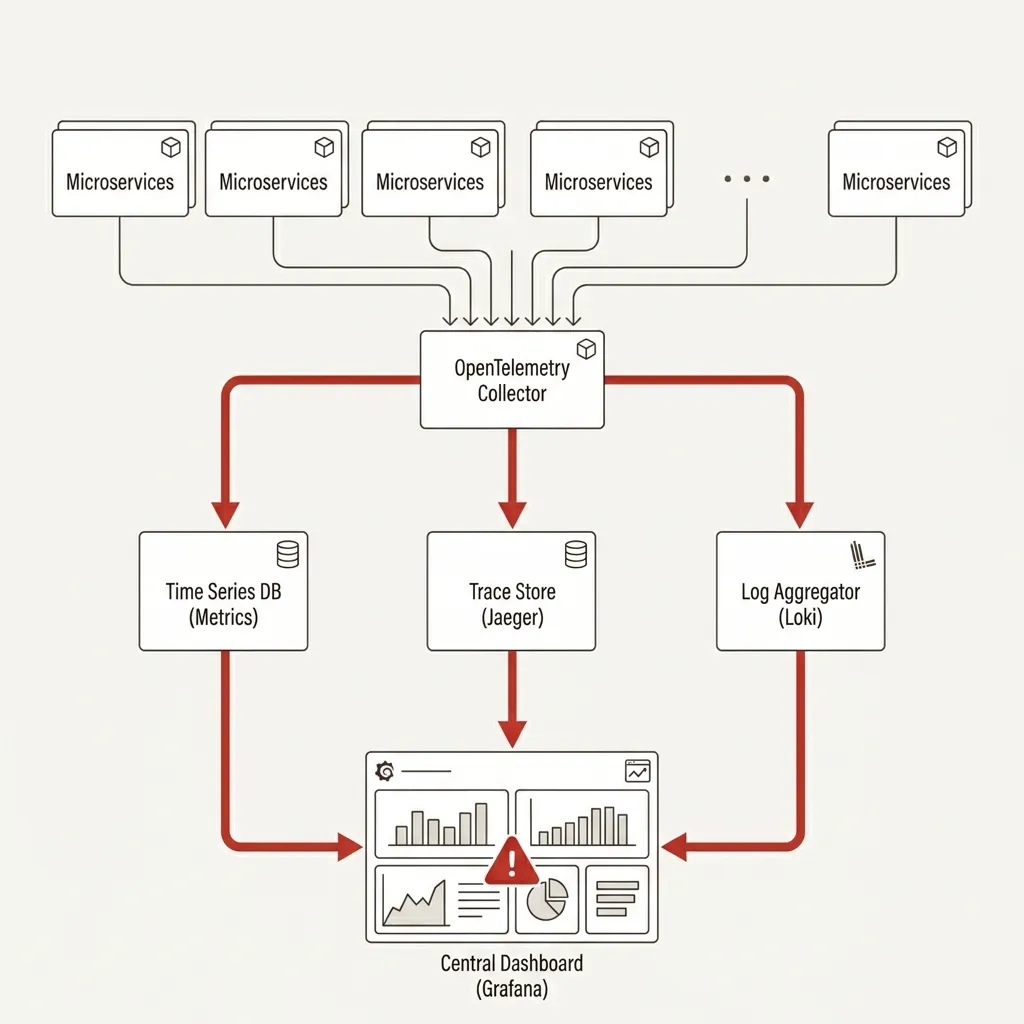
OpenTelemetry
OpenTelemetry is the industry-standard, vendor-neutral SDK for generating traces, metrics, and logs. Instrument once, export to any backend.
var tracer = otel.Tracer("order-service")

func ProcessOrder(ctx context.Context, orderID string) error {
    ctx, span := tracer.Start(ctx, "ProcessOrder",
        trace.WithAttributes(attribute.String("order.id", orderID)),
    )
    defer span.End()

    ctx, dbSpan := tracer.Start(ctx, "db.query.getOrder")
    order, err := db.GetOrder(ctx, orderID)
    dbSpan.End()

    if err != nil {
        span.RecordError(err)
        span.SetStatus(codes.Error, err.Error())
        return err
    }

    // Context carries the trace — downstream spans link automatically
    return paymentService.Charge(ctx, order)
}
Connecting the Three Pillars
Inject the OpenTelemetry trace ID into your structured log lines:
span := trace.SpanFromContext(ctx)
logger.InfoContext(ctx, "order processed",
    "trace_id", span.SpanContext().TraceID().String(),
    "span_id",  span.SpanContext().SpanID().String(),
    "order_id", orderID,
)
Now when you find a slow trace in your tracing tool, copy the trace_id and search your log aggregator for all log lines from that exact request — across every service. The three pillars become one diagnostic system.
The Instrumentation Minimum
Week 1:
- Structured JSON logging with correlation IDs
- Request/response logging for every HTTP endpoint
- RED method metrics for all services
- Log aggregation somewhere searchable
Month 1:
- Distributed tracing with OpenTelemetry on the critical path
- Database query spans
- External API call spans
- Dashboards for RED metrics per endpoint
Ongoing:
- SLO definitions with burn-rate alerts
- Business-level metrics (payment success rate, job completion rate)
The Discipline
Observability isn’t a tool you install. It’s a discipline.
Before shipping any new feature, ask: if this breaks at 2am, what information do I need to diagnose it? Then make sure that information is emitted.
The teams that handle production incidents well are not the teams with the most expensive tools. They’re the teams who built the habit of instrumenting their services so “what happened?” always has a clear answer.
Ellomas Technologies builds reliable software for credit, power, and operations systems. We design and implement observability infrastructure for teams that need to understand their systems in production — not just know they’re running.