Executive Summary
Nigeria is home to approximately 220 million people and a fast-growing digital payments ecosystem that processed N1.07 quadrillion in transactions in 2024. Yet as of 2024, only 33 million Nigerians — roughly 15% of the adult population — have a credit record in any bureau database.
The other 85% are credit invisible: people whose financial behaviour is entirely unobservable to formal lenders because the data infrastructure to capture and share it does not yet exist at scale.
This report examines the structural causes of Nigeria’s credit gap, compares it against peer markets in Africa and globally, and identifies what the technical and regulatory infrastructure build required to close it actually looks like.
Data Sources: EFInA Access to Finance Survey 2023; CRC Credit Bureau Ltd; FirstCentral Credit Bureau; National Credit Regulator (South Africa) Q4 2023; TransUnion Kenya Q4 2023 Credit Industry Insights; CFPB Consumer Credit Reports 2023; World Bank Financial Inclusion Database (Findex 2021, latest available).
Section 1: The Scale of the Gap
1.1 How Many Nigerians Have a Credit Record?
Nigeria has three licensed credit bureaus operating under the Credit Reporting Act 2017: CRC Credit Bureau Ltd, FirstCentral Credit Bureau (formerly XDS), and CreditRegistry. CRC — the largest — reported 33 million individuals in its database as of mid-2024, with 29.4 million credit searches conducted in 2023 and over 10 million in Q1 2024 alone.
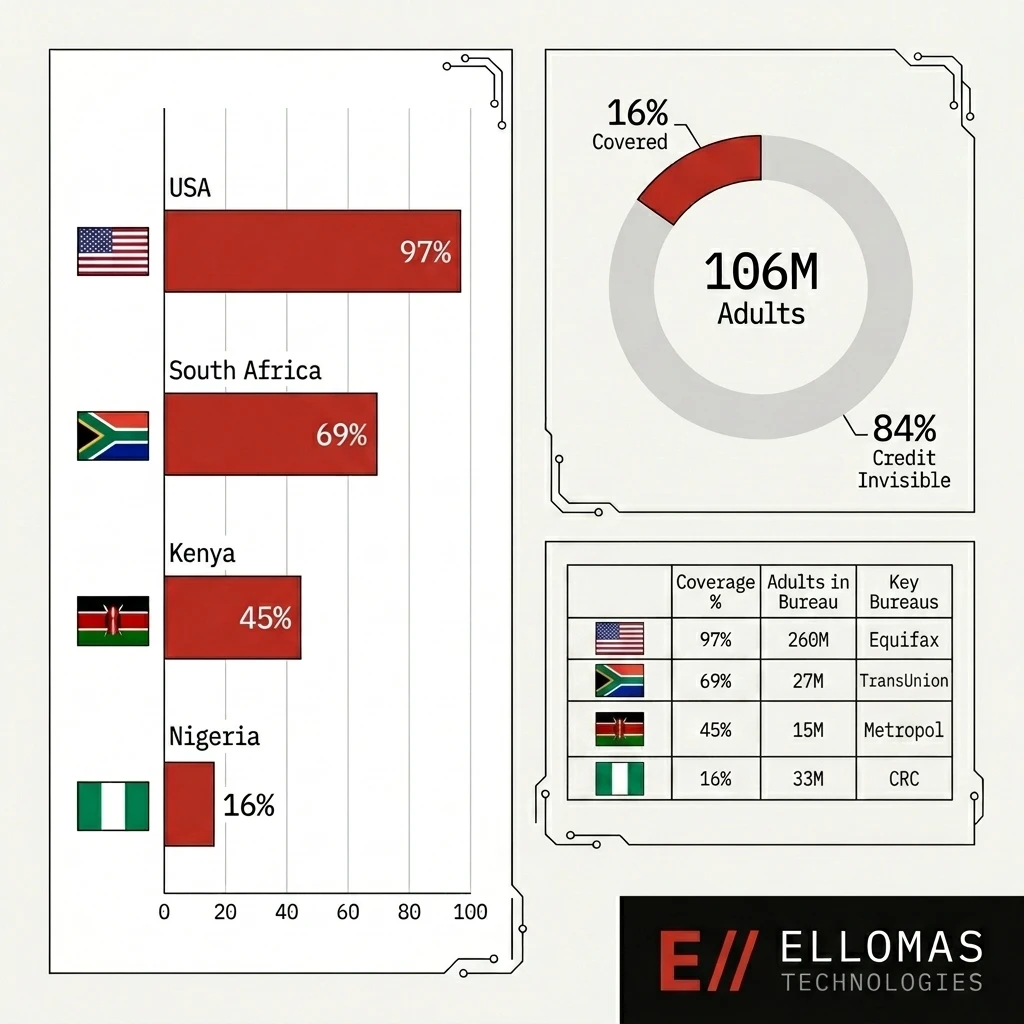
The adult population of Nigeria (18+) is estimated at approximately 106 million based on NBS population projections.
| Metric | Figure | Source |
|---|---|---|
| Total population (2024 est.) | ~220 million | NBS Nigeria |
| Adult population (18+) est. | ~106 million | NBS / UN Population Data |
| Individuals in CRC database | 33 million | CRC Credit Bureau, 2024 |
| Credit bureau coverage (adults) | ~15–16% | EFInA / CEIC Data 2023 |
| Formal financial inclusion | 64% | EFInA A2F Survey 2023 |
| Credit-active (have active loan) | ~14% | EFInA A2F Survey 2023 |
The gap between formal financial inclusion (64%) and credit bureau coverage (16%) reveals the core problem: millions of Nigerians interact with formal financial services — they have bank accounts, use mobile money, pay bills digitally — but none of that financial behaviour flows into the credit information system.
1.2 What Does “Credit Invisible” Actually Mean?
A credit-invisible individual is not necessarily poor, uninformed, or financially irresponsible. They may:
- Have a salary account at a Tier-1 bank that shows 3 years of consistent deposits
- Pay rent, electricity, and subscriptions reliably every month
- Run an SME with 5 years of Paystack transaction history
- Have never defaulted on any obligation in their life
None of this data is captured by a credit bureau unless the lender (or the utility, or the telco) is a registered data furnisher — and most informal and semi-formal providers are not.
The result: a responsible borrower with a 10-year banking history may be completely indistinguishable from someone with no history at all when a formal lender queries the bureau.
Section 2: Comparative Analysis — Nigeria vs. Peer Markets
2.1 Credit Bureau Coverage Rates
The contrast with other markets demonstrates how far Nigeria’s credit information infrastructure lags — and how significant the opportunity is.
| Country | Credit Bureau Coverage (% of adults) | Population | Credit-Active Consumers | Key Bureau(s) | Source |
|---|---|---|---|---|---|
| 🇺🇸 United States | ~97% | 335 million | ~260 million | Equifax, Experian, TransUnion | CFPB 2023 |
| 🇿🇦 South Africa | ~69% | 60 million | 27.46 million credit-active | TransUnion, Experian, Compuscan | NCR Q4 2023 |
| 🇰🇪 Kenya | ~40–50% est. | 55 million | Growing, driven by mobile loans | Metropol, TransUnion | TransUnion Kenya Q4 2023 |
| 🇳🇬 Nigeria | ~15–16% | 220 million | ~33 million in bureau DB | CRC, FirstCentral, CreditRegistry | EFInA 2023 / CRC 2024 |
Figure 1: Credit Bureau Coverage as % of Adult Population
USA          ████████████████████████████████████████████████ 97%
South Africa ██████████████████████████████████░░░░░░░░░░░░░░ 69%
Kenya        ████████████████████████░░░░░░░░░░░░░░░░░░░░░░░░ 45%
Nigeria      ████████░░░░░░░░░░░░░░░░░░░░░░░░░░░░░░░░░░░░░░░░ 16%
             0%      25%      50%      75%      100%
Source: CFPB 2023; NCR South Africa Q4 2023; TransUnion Kenya Q4 2023; EFInA A2F 2023; CRC Credit Bureau 2024
2.2 What Each Market Got Right
Understanding how peer markets achieved higher coverage explains the path forward.
United States (~97% coverage)
The US achieves near-universal coverage because credit reporting is deeply embedded across the entire economy. Every bank account, credit card, mortgage, auto loan, student loan, and utility account is reported to one or more of the three major bureaus (Equifax, Experian, TransUnion). The Fair Credit Reporting Act (FCRA) provides the legal framework that mandates reporting accuracy and gives consumers rights. The result: it is nearly impossible to have a financial relationship in the US that does not generate a credit record.
South Africa (~69% coverage)
The National Credit Act (2005) mandated that all credit providers register with the NCR and submit data to registered credit bureaus. This regulatory compulsion expanded coverage dramatically. South Africa also has strong formal sector employment relative to its overall population, which means more people have formal credit products to report. As of December 2023, the NCR counted 27.46 million credit-active consumers, of whom 63.96% were in good standing.
Kenya (~40–50% coverage)
Kenya’s growth has been driven by a unique mechanism: mobile loan data. Products like M-Pesa-linked micro-loans (Fuliza, M-Shwari) are reported to credit bureaus, and TransUnion Kenya’s Q4 2023 report confirms that mobile loans account for over 50% of active loan accounts in the Kenyan bureau system. Kenya essentially solved part of the coverage problem not through formal banking expansion but through integrating digital informal credit into the bureau reporting system.
Section 3: Why Nigeria’s Gap Persists
3.1 The Data Furnisher Problem
A credit bureau is only as complete as the data it receives. In Nigeria, the pool of registered data furnishers is structurally too narrow.
Who reports to Nigerian credit bureaus (regulated data furnishers):
- Deposit Money Banks (DMBs)
- Microfinance Banks (MFBs) — inconsistently
- Some licensed consumer lenders (fintechs)
Who does NOT report to Nigerian credit bureaus:
- Telecommunications companies (MTN, Airtel, Glo postpaid billing data)
- EKEDC, IKEDC, and other electricity distribution companies
- Buy-Now-Pay-Later providers (most)
- Cooperatives and savings groups
- State government payroll systems
- Informal moneylenders and peer lending networks
The implication: a significant portion of the credit behaviour that actually happens in Nigeria is completely invisible to the formal credit system. An MTN subscriber who pays a N15,000 postpaid bill every month for 5 years has demonstrated reliable financial commitment. That data exists. It simply does not flow to any bureau.
3.2 The SME Blind Spot
Nigeria’s SME sector is large — the National Bureau of Statistics estimates 41.5 million MSMEs contributing approximately 48% of GDP. The vast majority operate entirely outside the formal credit information system.
An SME owner who has processed N50 million in payments through Paystack over 3 years, maintains a consistent balance in a business account, and has never missed a supplier payment has generated substantial evidence of creditworthiness. None of this is standardly captured in a credit bureau file.
The result: when that business owner applies for a working capital loan, the lender has no bureau data to query and must rely on manual financial statement review — slow, expensive, and accessible only to businesses large enough to produce audited accounts.
3.3 Geographic and Channel Distribution
Nigeria’s credit bureau access problem compounds at the geographic level.
Table 2: Formal Credit Access by Geopolitical Zone (Nigeria)
| Zone | Formal Credit Access (%) | Source |
|---|---|---|
| South West (incl. Lagos) | ~22% | EFInA A2F 2023 |
| South East | ~18% | EFInA A2F 2023 |
| South South | ~16% | EFInA A2F 2023 |
| North Central | ~12% | EFInA A2F 2023 |
| North West | ~7% | EFInA A2F 2023 |
| North East | ~5% | EFInA A2F 2023 |
The North West and North East — home to over 60 million people — have formal credit access rates in the single digits. Any solution that relies on formal banking sector data alone will leave these populations entirely unaddressed.
Section 4: The Infrastructure Required to Close the Gap
4.1 Alternative Data: The Bridge
The fastest path to expanding credit coverage is alternative data — non-traditional sources that correlate with creditworthiness:
Tier 1: High-value, immediately usable
- Mobile money transaction history (OPay, PalmPay, Kuda, Moniepoint) — millions of accounts, consistent transaction records
- Airtime purchase patterns — stable airtime purchase frequency correlates with income stability
- Bank account cash flow — income/expense patterns via open banking (Mono, Okra)
Tier 2: Medium-value, integration required
- Utility payment history — DISCO billing data, especially prepaid credit patterns
- Digital subscription behaviour — DSTV, Netflix, Spotify payment regularity
- Payroll data — direct payroll feed from employers (common in Kenya, uncommon in Nigeria)
Tier 3: Emerging, regulatory work required
- Social commerce behaviour — informal trade patterns through WhatsApp/Instagram merchant accounts
- Agricultural input purchase patterns — credit for smallholder farmers via agri-fintech platforms
- Rental payment history — verified rent payment records
4.2 The Technical Stack for Alternative Credit Scoring
Building a functional alternative credit scoring system requires four layers:
graph LR
    L1[Layer 1: Ingestion] --- L2[Layer 2: Normalization]
    L2 --- L3[Layer 3: Features]
    L3 --- L4[Layer 4: Scoring]

    style L1 fill:#fff,stroke:#333,color:#000
    style L2 fill:#fff,stroke:#333,color:#000
    style L3 fill:#fff,stroke:#333,color:#000
    style L4 fill:#c0392b,stroke:#c0392b,color:#fff
The most technically complex layer is entity resolution: confirming that the mobile money account, the bank account, and the BVN all belong to the same individual before aggregating their financial behaviour into a unified profile. Nigeria’s BVN system provides the anchor for this — one of the most significant infrastructure advantages Nigeria has relative to some peer markets.
4.3 Open Banking as an Accelerant
The CBN’s Open Banking Framework, released in 2021 and progressively refined, mandates that Tier-1 and Tier-2 banks provide standardized API access to customer account data (with consent). This is the mechanism through which the alternative data described above can be accessed programmatically.
Table 3: Open Banking API Adoption Status (Estimated, 2024)
| Bank Tier | API Availability | Data Granularity | Reliability |
|---|---|---|---|
| Tier 1 (Access, GT, Zenith, First, UBA) | Partial — via aggregators | Statement-level (90 days) | Medium |
| Tier 2 (Stanbic, FCMB, Fidelity, etc.) | Via aggregators only | Statement-level (varies) | Low–Medium |
| Microfinance Banks | Very limited | Basic account info | Low |
| Mobile Money Operators | Selective API programs | Transaction-level | Medium |
Source: Ellomas internal assessment; Mono/Okra public documentation, 2024
The reliability and granularity of open banking data in Nigeria is still maturing. Direct bank integrations are inconsistent. Aggregators (Mono, Okra, Stitch) have normalized much of this, but coverage of Tier-2 and MFB institutions remains fragmented.
Section 5: The Fraud and Quality Problem
Expanding credit bureau coverage creates a secondary challenge: data quality and fraud resistance.
Nigeria’s NIBSS Annual Fraud Landscape reports that financial institutions lost N52.26 billion to fraud in 2024, up from N17.67 billion in 2023. A significant portion of this is identity fraud — fake or compromised BVNs used to open accounts and access credit products.
As alternative data is incorporated into credit scoring, the attack surface expands. An adversary who understands that 6 months of consistent mobile money transactions produces a high alternative credit score can engineer that history artificially.
Robust credit infrastructure therefore requires:
- Liveness and identity verification beyond BVN at onboarding
- Behavioral biometrics to detect manufactured transaction patterns
- Velocity checks that flag accounts whose activity pattern changed sharply before a credit application
- Bureau cross-referencing to catch synthetic identities that appear in one bureau but not others
This is not a problem unique to Nigeria — the US credit system deals with synthetic identity fraud at scale — but it is a problem that must be architected for from the start, not retrofitted.
Section 6: What Closing the Gap Unlocks
6.1 Credit Market Size Potential
Nigeria’s formal consumer credit market was estimated at approximately N5.7 trillion in total outstanding credit as of 2023 (NBS). Given a credit-active population of ~14%, expanding coverage to 50% of adults — a still-conservative target — would represent a potential addressable market expansion of more than 3× the current base, assuming comparable credit demand across the newly covered population.
This is a conservative estimate. The evidence from Kenya’s mobile credit expansion suggests that previously credit-invisible populations, when given access to affordable credit, demonstrate strong demand.
6.2 SME Financing Unlock
The World Bank estimates Nigeria’s SME financing gap at approximately $158 billion — the difference between what SMEs need and what formal credit markets currently provide. Thin credit files are a primary barrier: lenders cannot assess risk without bureau data, so they do not lend.
A functional alternative data credit system that can produce a reliable risk profile for an SME based on 12 months of payment transaction data could directly unlock a portion of this financing gap.
6.3 The Systemic Effect
Every new data furnisher who joins the credit reporting ecosystem improves the system for all participants. A telco that begins reporting creates coverage for its 50 million subscribers. A DISCO that reports creates payment history records for 10 million households. Each integration compounds.
This is the key insight of network-effect infrastructure: the value of closing the gap is not linear with the number of people covered. Every new data point improves the model accuracy for everyone, because the scoring system gets better data to train on and more reference points to calibrate against.
Conclusion
Nigeria’s credit gap is not primarily a demand problem or a population problem. It is an infrastructure problem. The financial behaviour that could serve as credit evidence exists — in mobile money records, in bank account cash flows, in utility payment histories, in years of consistent Paystack transaction data. What is missing is the plumbing to collect it, normalize it, link it to verified identities, and make it available to lenders in a reliable, standardized form.
The markets that have closed comparable gaps — South Africa through regulatory mandate, Kenya through mobile credit integration — did so through deliberate, co-ordinated infrastructure investment: specific legislation, expanded bureau data furnisher requirements, and the technical integration work to connect non-traditional data sources to the credit information ecosystem.
Nigeria has the raw material: 220 million people, a functioning BVN identity layer, an open banking framework, and a digital payments volume that grew 80% in a single year. What it needs is the infrastructure layer that turns that activity into legible credit histories.
Appendix: Data Sources and Methodology
| Source | Data Used | Date |
|---|---|---|
| EFInA Access to Finance (A2F) Survey 2023 | Financial inclusion rates, credit access by zone | Published 2023 |
| CRC Credit Bureau Ltd | Database size (33M), search volumes | Mid-2024 |
| National Credit Regulator (South Africa) Q4 2023 | Credit-active consumers, good standing % | Dec 2023 |
| TransUnion Africa — Kenya Market Analytics | Mobile loan share, market trends | Q4 2023 |
| CFPB Consumer Credit Reports | US credit invisibility rates | 2020–2023 |
| NIBSS Annual Fraud Landscape 2024 | Fraud loss figures | 2024 |
| National Bureau of Statistics Nigeria | Nigeria population estimates | 2024 |
| World Bank Global Findex Database | Historical credit bureau coverage | 2021 (last published) |
| Ellomas Internal Assessment | Open banking API coverage table | 2024 |
Coverage percentages for Kenya and Nigeria are estimates based on available industry data. The World Bank Doing Business “Depth of Credit Information Index” was discontinued in 2021; no direct replacement index exists. Figures cited represent the best available estimates from active sources as of the report publication date.
Ellomas Technologies builds credit infrastructure and financial data systems for lenders, fintechs, and operators across Nigeria and West Africa. If you are building in this space and would like to discuss the technical architecture, reach out.